Share & Dividend Information
Last Traded Share Price
£0.90
Number of Shares in Issue
175,248,791
Market Capitalisation
£157,723,912
Share Trades 1st January 2018 to Date
TRADE DATE | NUMBER OF SHARES SOLD | TRADE PRICE £ |
| 28/03/25 | 49,940 | 0.90 |
| 27/02/25 | 20,000 | 0.80 |
| 30/01/25 | 32,000 | 0.90 |
| 16/12/24 | 12,000 | 0.96 |
| 08/12/24 | 280,806 (scrip) | 0.82 |
| 11/11/24 | 80,200 | 0.82 |
| 26/09/24 | 116,000 | 0.85 |
| 29/08/24 | 49,475 | 0.96 |
| 25/07/24 | 7,025 | 0.98 |
| 11/06/24 | 371,705 (scrip) | 0.98 |
| 31/05/24 | 90,000 | 0.98 |
| 25/04/24 | 12,500 | 0.98 |
| 28/03/24 | 10,750 | 0.99 |
| 29/02/24 | 58,915 | 0.99 |
| 25/01/24 | 93,530 | 0.99 |
| 21/12/23 | 25,000 | 1.01 |
| 07/12/23 | 268,200 (scrip) | 1.00 |
| 30/11/23 | 120,760 | 1.00 |
| 26/10/23 | 160,000 | 1.00 |
| 25/09/23 | 11,000 | 1.00 |
| 06/09/23 | 60,250 | 0.99 |
| 06/09/23 | 4,850 | 0.98 |
| 24/08/23 | 93,365 | 0.99 |
| 24/08/23 | 4,000 | 0.98 |
| 18/08/23 | 44,890 | 0.99 |
| 07/07/23 | 34,985 | 0.99 |
| 28/06/23 | 112,975 | 0.99 |
| 13/06/23 | 405,890 (scrip) | 1.01 |
| 13/06/23 | 9,000 | 0.99 |
| 02/06/23 | 77,590 | 1.00 |
| 02/06/23 | 51,695 | 0.99 |
| 02/06/23 | 50,000 | 0.98 |
| 11/04/23 | 40,750 | 1.02 |
| 21/03/23 | 9,620 | 1.02 |
| 02/03/23 | 39,390 | 1.04 |
| 22/02/23 | 29,000 | 1.04 |
| 10/01/23 | 60,125 | 1.04 |
| 26/01/23 | 84,090 | 1.04 |
| 03/01/23 | 100,000 | 1.04 |
| 22/12/22 | 200,000 | 1.04 |
| 07/12/22 | 70,000 | 1.02 |
| 07/12/22 | 310,175 (scrip) | 1.00 |
| 18/11/22 | 130,000 | 1.01 |
| 03/11/22 | 70,000 | 1.00 |
| 18/10/22 | 20,000 | 0.99 |
| 18/10/22 | 50,000 | 0.98 |
| 28/09/22 | 85,520 | 0.98 |
| 20/09/22 | 24,000 | 0.99 |
| 09/09/22 | 175,000 | 1.00 |
| 08/09/22 | 51,450 | 1.00 |
| 07/09/22 | 27,000 | 1.02 |
| 31/08/22 | 8,040 | 1.02 |
| 23/08/22 | 650 | 1.14 |
| 19/08/22 | 50,000 | 1.16 |
| 16/08/22 | 20,000 | 1.18 |
| 11/08/22 | 45,000 | 1.20 |
| 13/07/22 | 25,960 | 1.30 |
| 14/06/22 | 385,010 (scrip) | 1.35 |
| 03/06/22 | 308,870 | 1.32 |
| 27/04/22 | 220,150 | 1.35 |
| 23/03/22 | 238,510 | 1.39 |
| 04/03/22 | 112,500 | 1.38 |
| 14/02/22 | 273,360 | 1.37 |
| 28/01/22 | 47,980 | 1.30 |
| 29/12/21 | 300,000 | 1.30 |
| 08/12/21 | 233,075 (scrip) | 1.24 |
| 03/12/21 | 375,000 | 1.24 |
| 12/11/21 | 250,000 | 1.24 |
| 25/10/21 | 420,000 | 1.24 |
| 13/10/21 | 250,000 | 1.20 |
| 20/09/21 | 37,500 | 1.05 |
| 19/08/21 | 82,500 | 1.00 |
| 04/08/21 | 80,000 | 0.90 |
| 23/07/21 | 15,000 | 0.80 |
| 20/07/21 | 90,000 | 0.80 |
| 06/07/21 | 122,840 | 0.80 |
| 15/06/21 | 493,930 (scrip) | 0.72 |
| 02/06/21 | 100,000 | 0.73 |
| 23/04/21 | 82,500 | 0.72 |
| 31/03/21 | 289,250 | 0.72 |
| 15/03/21 | 170,550 | 0.70 |
| 08/01/21 | 236,500 | 0.70 |
| 07/12/20 | 800,000 | 0.66 |
| 09/10/20 | 407,955 | 0.64 |
| 15/09/20 | 395,000 | 0.59 |
| 07/08/20 | 82,415 | 0.64 |
| 03/07/20 | 568,830 | 0.60 |
| 24/04/20 | 26,355 | 0.60 |
| 12/02/20 | 375,000 | 0.69 |
| 12/02/20 | 82,500 | 0.67 |
| 20/12/19 | 345,000 | 0.69 |
| 20/12/19 | 75,000 | 0.68 |
| 25/10/19 | 185,000 | 0.69 |
| 25/10/19 | 499,850 | 0.68 |
| 27/09/19 | 45,000 | 0.68 |
| 31/08/19 | 217,650 | 0.68 |
| 09/08/19 | 67,260 | 0.69 |
| 09/08/19 | 175,000 | 0.68 |
| 12/07/19 | 472,310 | 0.69 |
| 07/06/19 | 165,000 | 0.69 |
| 09/05/19 | 86,250 | 0.69 |
| 03/04/19 | 14,285 | 0.70 |
| 13/03/19 | 14,290 | 0.70 |
| 01/03/19 | 368,825 | 0.68 |
| 31/12/18 | 60,000 | 0.70 |
| 31/12/18 | 419,075 | 0.68 |
| 23/11/18 | 230,000 | 0.68 |
| 10/10/18 | 527,000 | 0.64 |
| 01/10/18 | 1,802,600 (New) | 0.64 |
| 15/08/18 | 357,500 | 0.64 |
| 13/07/18 | 50,000 | 0.64 |
| 15/06/18 | 174,000 | 0.64 |
| 01/05/18 | 55,500 | 0.63 |
| 02/04/18 | 372,500 | 0.63 |
| 06/02/18 | 250,000 | 0.63 |
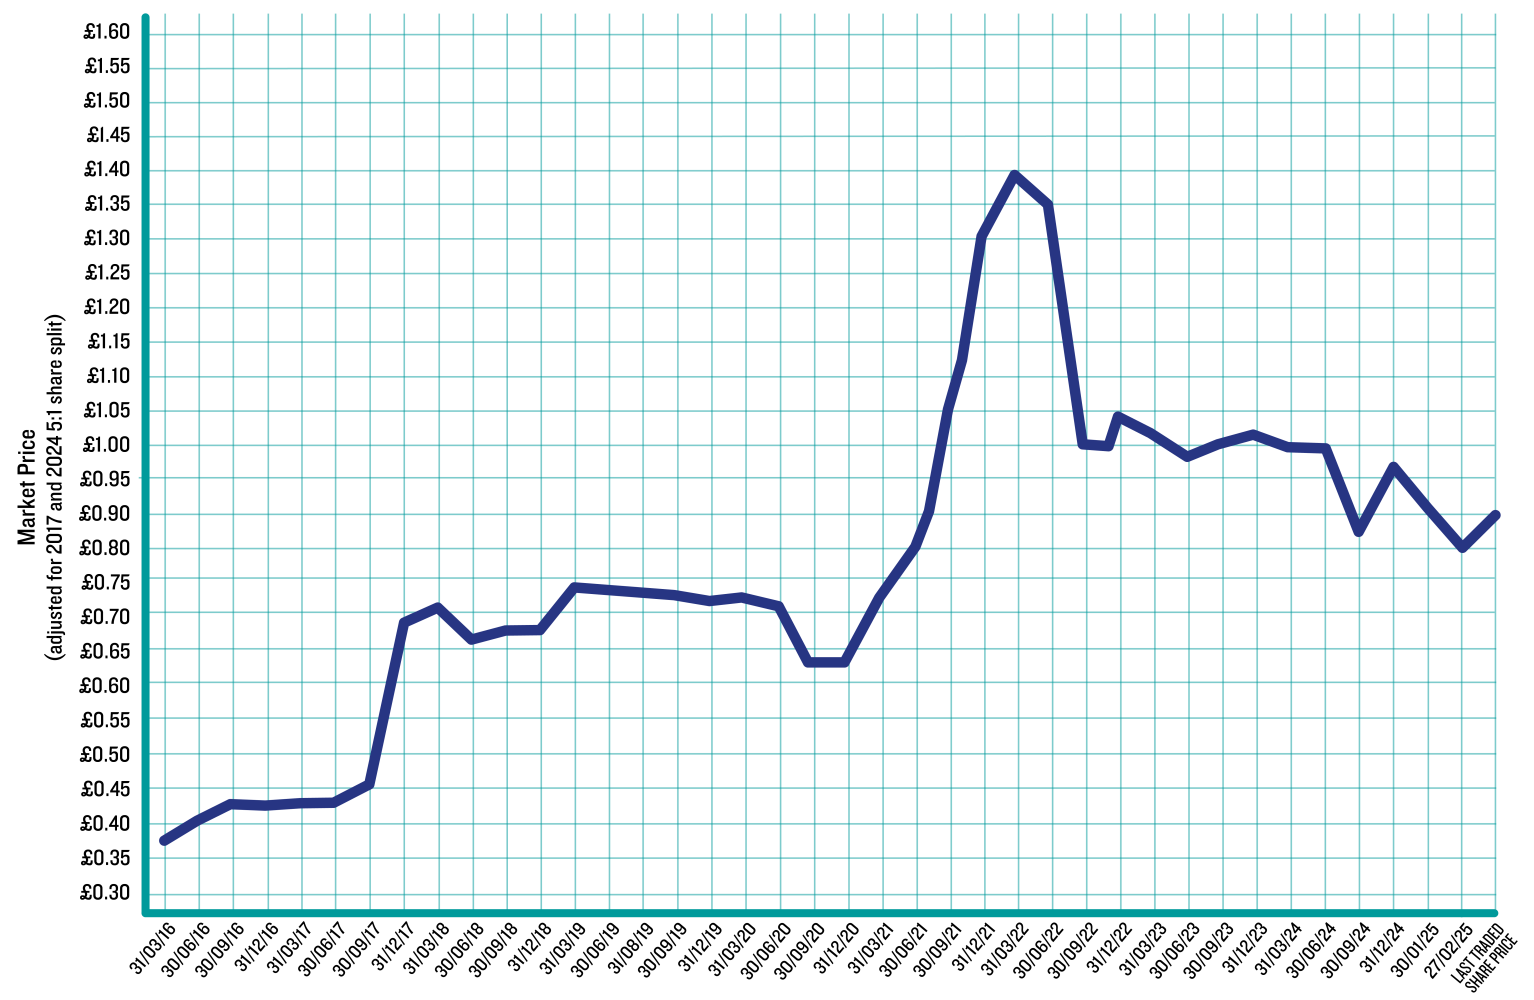
Share Price Chart

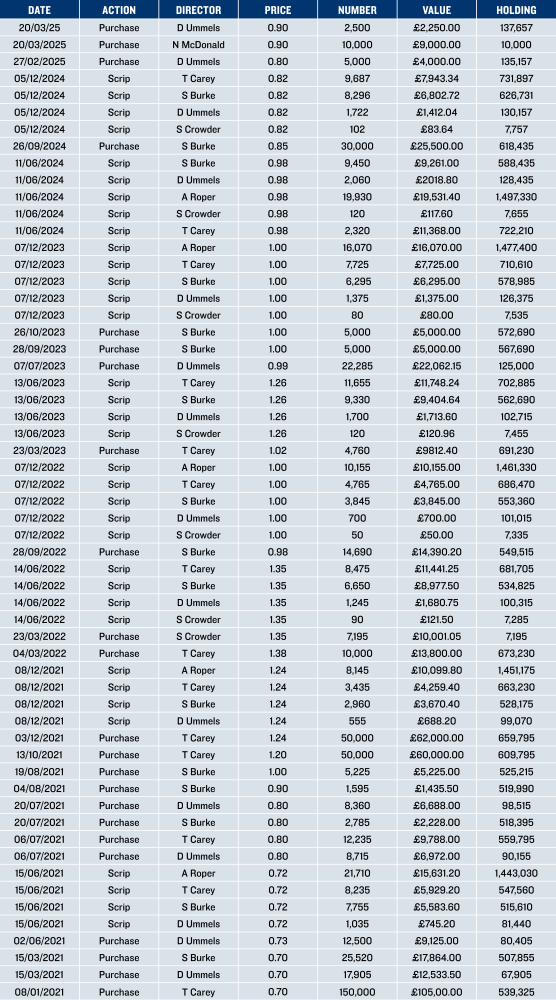
Director Share Transactions Since 1 January 2020

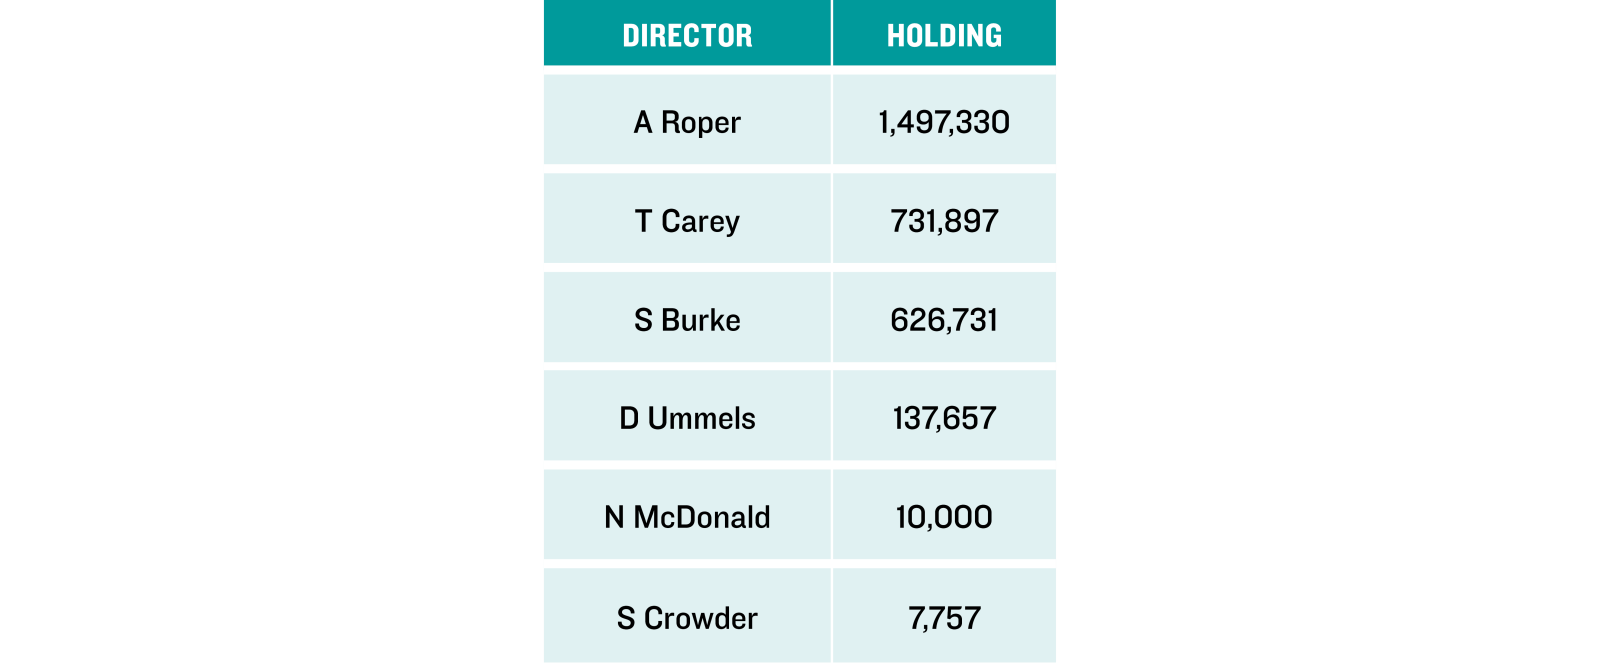
Latest Director Shareholdings

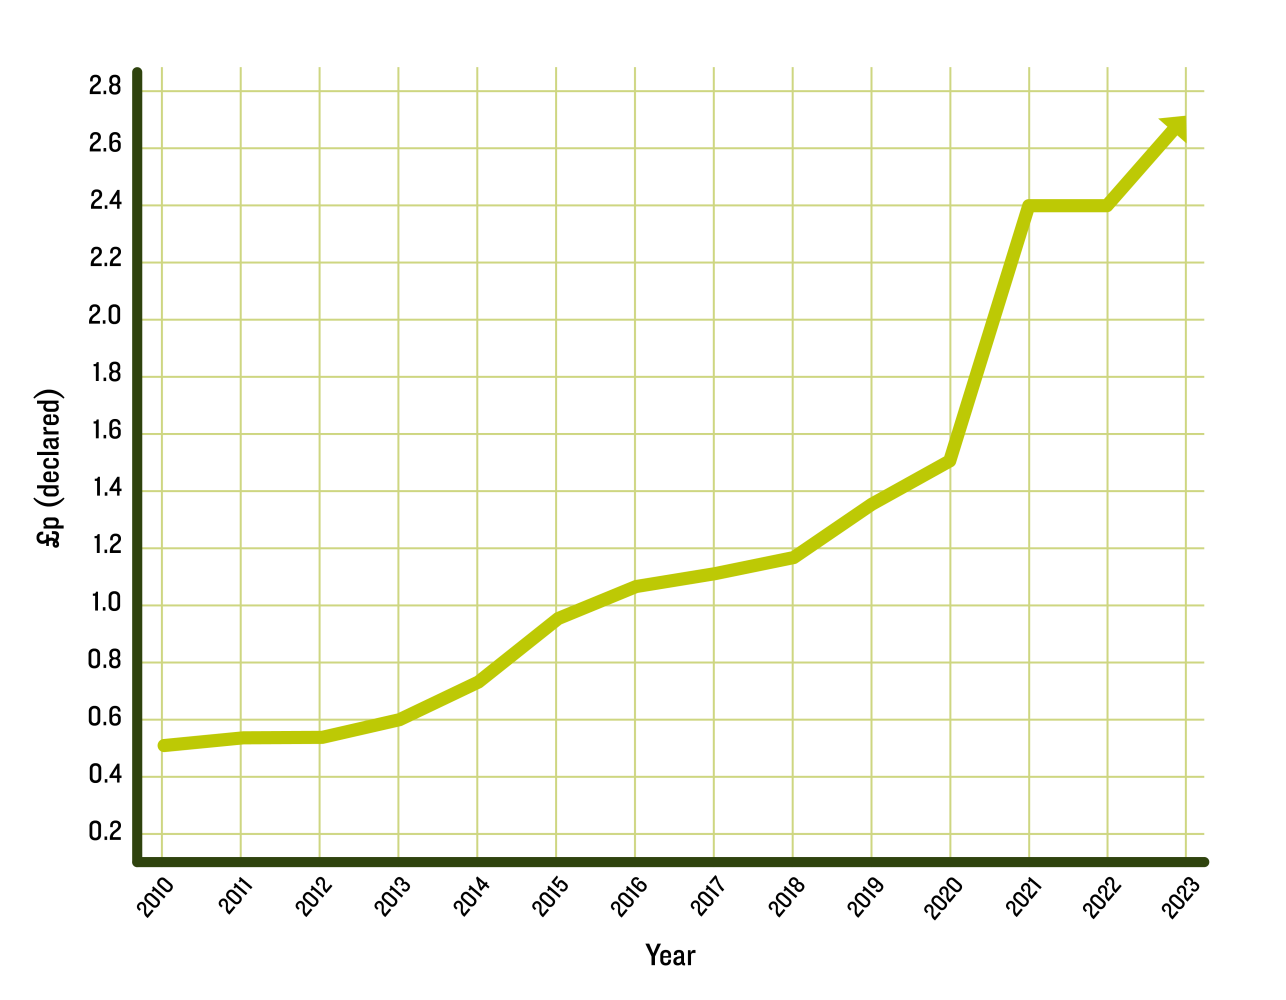
Dividend Chart
Blue Diamond Ltd Dividend Policy
When setting the dividend, the Board considers a number of factors. The most important factors affecting dividend policy are:
- The scale of, and the likely returns to be achieved from, investment opportunities in the core business, and
- The stated desire of shareholders to see debt finance managed within affordable and low-risk limits.
The Board also takes into account the macroeconomic environment, benchmark financial returns achievable in the investment market, the Company’s financial flexibility, risk management, and feedback from shareholders as a whole.
Our general aim over the next five years is to increase the dividend annually. The Company is, however, at a stage where there are investment opportunities to grow the core business and earn very attractive returns for shareholders. In this context, it is likely that dividend growth will be lower than earnings growth. In the longer term, as the development pipeline matures and our financing requirements moderate, the Board may look to increase the dividend at or above the rate of earnings growth.
An overriding consideration will always be maintaining debt at moderate levels, and so dividend payments, and any increase in dividend, will always be subject to keeping our debt ratios within stated policy.
The Board will review the dividend policy every year.
The Board’s aim is to pay an interim and final dividend each year, in June and December respectively.

